Predictive maintenance reduces maintenance costs by 18-25%. This number is not surprising for the many industrial businesses implementing this technique. Optimizing asset maintenance results in increased production line availability and is one of the industries paramount ambitions today. Predictive maintenance, or PdM, is nothing without monitoring, and we at Raytelligence want to present our contribution to this cost-effective trend. This blog post presents a video showcase of Raytelligence’s development of contactless vibration monitoring.
Predictive maintenance
Industry downtime may have severe economic backlashes and must be minimized in all industries. There are several strategies to reduce breakdown occurrences and reduce maintenance work, all with different impacts on the overall equipment effectiveness. Predictive maintenance is a strategy that generates high overall equipment effectiveness. Compared to preventive maintenance, predictive maintenance schedules as needed based on asset conditions instead at regular intervals. Analytical tools and techniques determine these asset conditions, and vibration analysis is one of the most common. Vibration analysis is used for rotating equipment that emits a specific vibrational rhythm. This rhythm has a certain frequency, and by analyzing it in real-time, one can detect misalignments, unbalanced elements, loose components, or motor issues. Such analysis is advanced and requires specific tools to measure vibrations in harsh or limited environments. This is where Raytelligence comes in.
Raytelligence is developing a sensor for contactless vibration monitoring, achieving the predictive maintenance strategy in cumbersome environments. Based on the RDZ2201 platform, the user can define which frequencies should generate output to the end system on the integrated web interface. It makes it simple for the user to connect to its IT system and is an effective tool in the most cost-effective industrial maintenance strategy.
Demonstrating the product
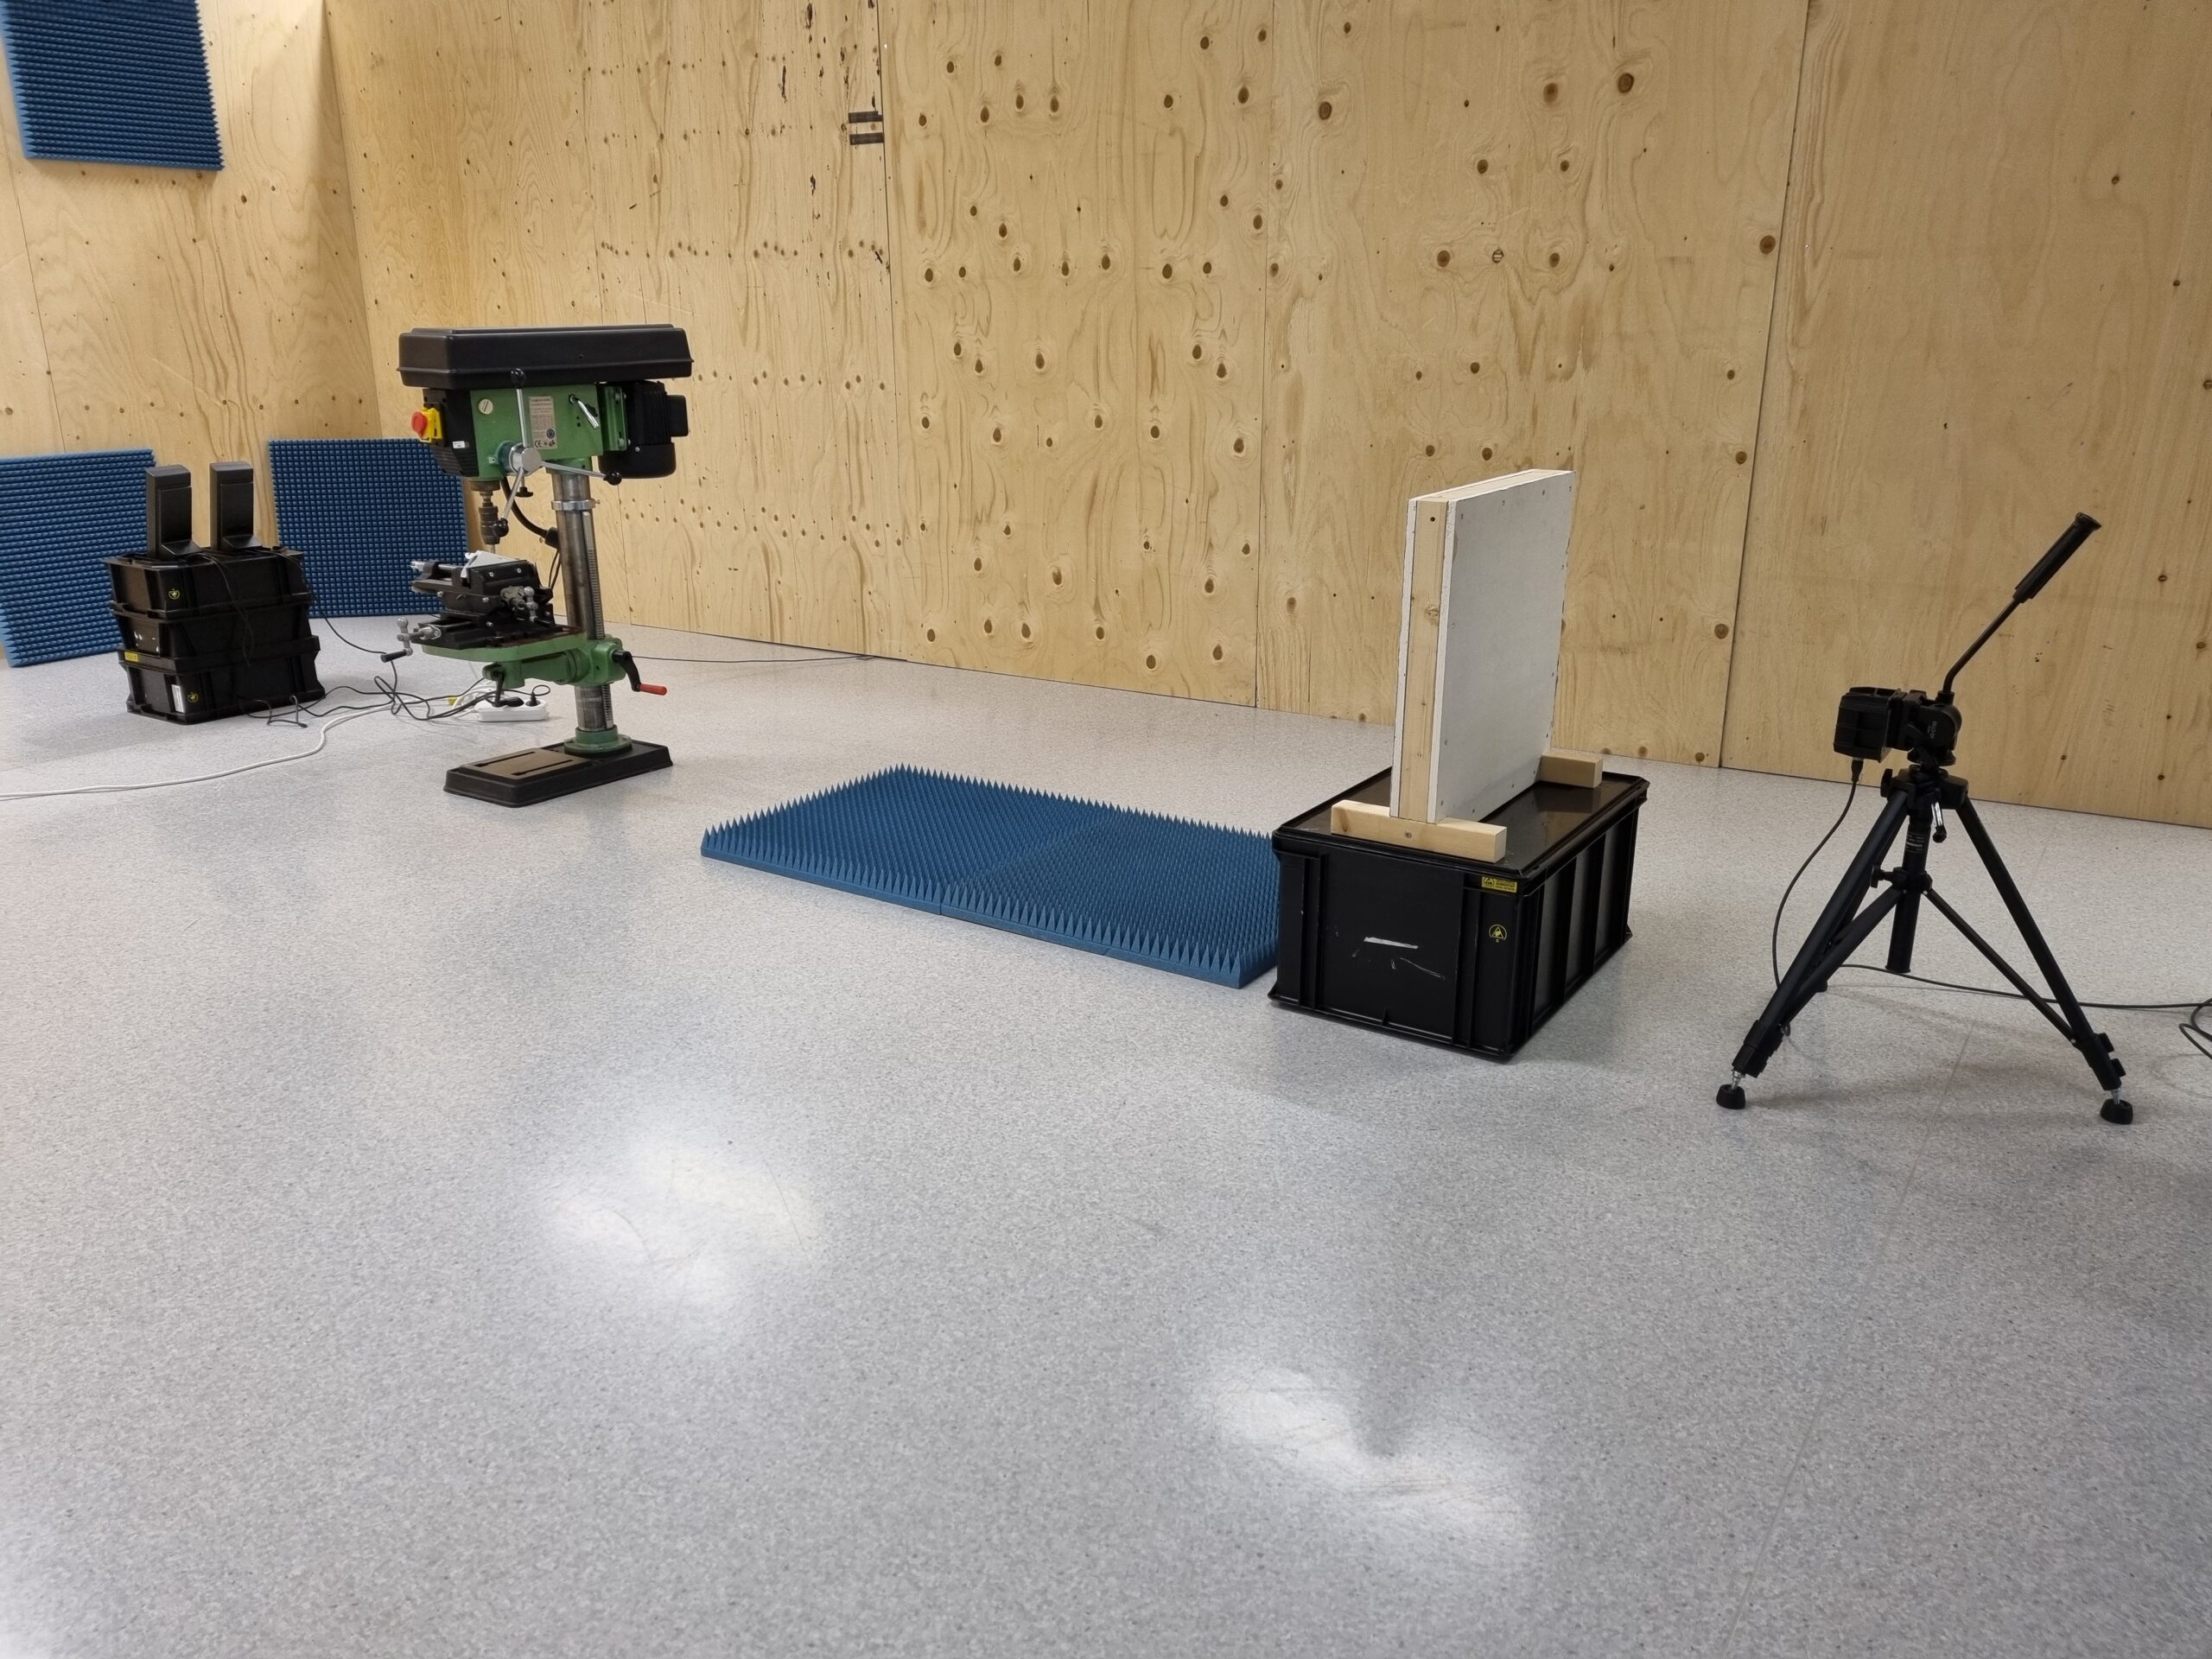
In the video demonstration, we will demonstrate the early development of contactless vibration monitoring and the utilization of radar technology. The image below describes the demonstration setup. The radar is mounted on a tripod at the far right and aimed at a pillar drill, 2.681m from the sensor. Next to the radar, there’s a 2x13mm thick dry plaster wall, simulating a wall or obstacle the sensor can measure through. Around the laboratory station, there are blue damping materials, creating a sound laboratory environment for the demonstration. The pillar drill is the industrial asset, operating with an internal rotating speed of approximately 1820 RPM. This rotation can vary based on other internal components and factors, but it approximates the drill’s vibrational rhythm of 30.333Hz.

The sensor has an onboard, integrated web interface that presents what the radar sees. In the lower right corner, there is a Range Profile. The higher the graph, the more significant target is reflected for that distance. A Vibration Spectrum for a defined distance is on the upper half of the screen. Subsequently, the higher the graph, the higher the intensity of a particular frequency. Remember the theoretical frequency we calculated based on the drill’s internal rotation. At the far right corner are three status cards, where the frequency card displays the most substantial vibration frequency of the focused object.
If you want to know more about this project, let us know!
