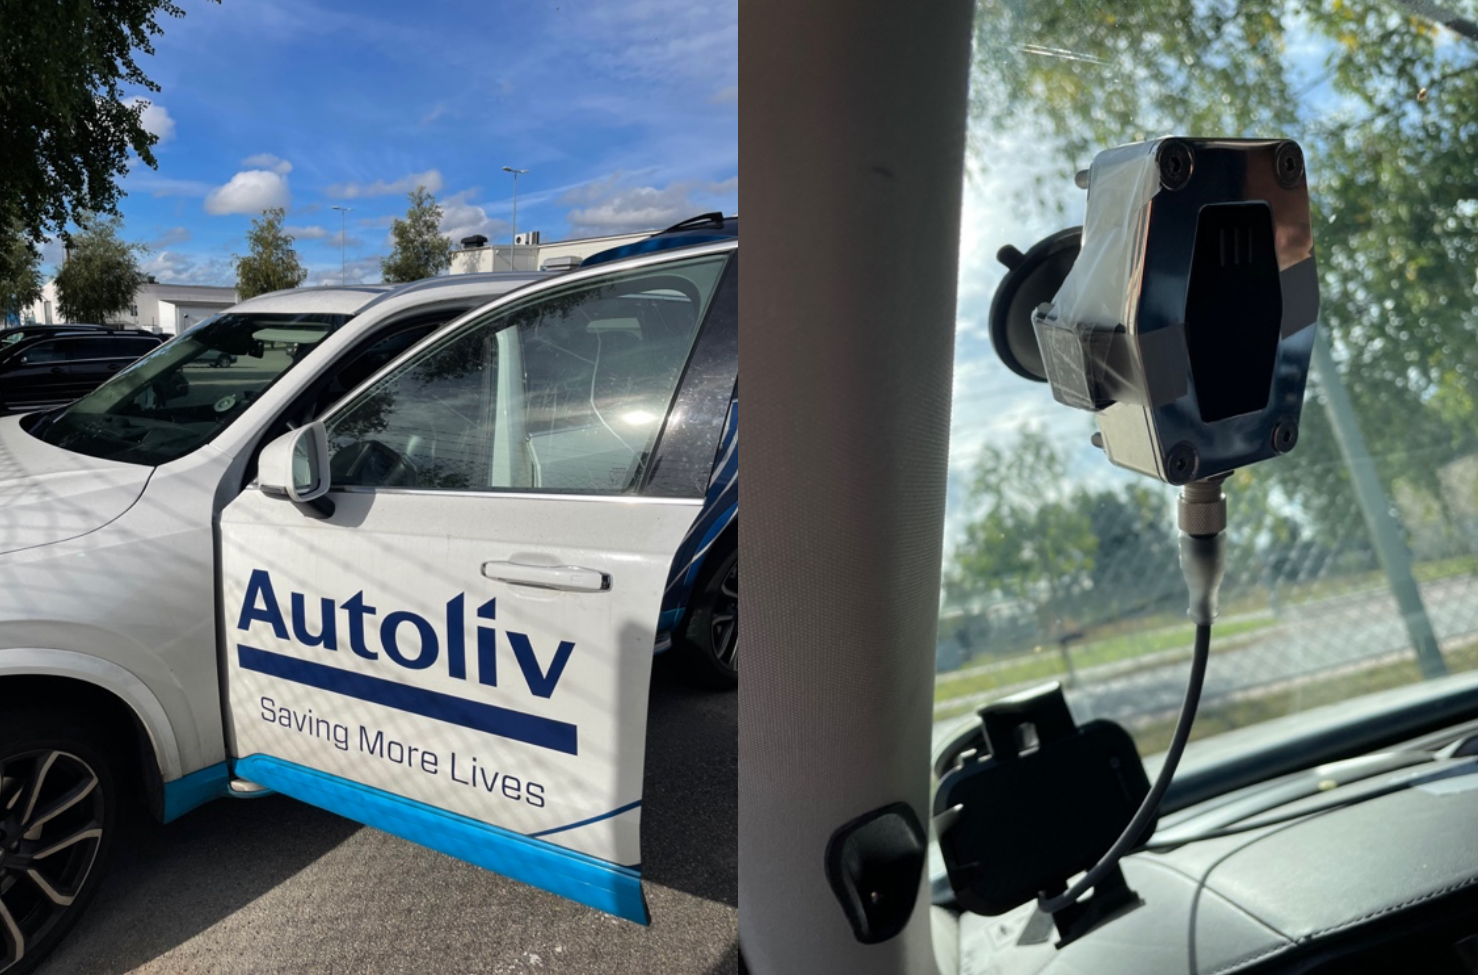
One of the collaborators is Autoliv, a worldwide leader in automotive safety systems. Autoliv is developing and manufacturing protective systems, mobility safety solutions, and pedestrian protection, naming some of Autoliv’s applications.
Raytelligence in Halmstad, neighboring Gothenburg along the west coast of Sweden, has high expertise in radar technology and a passion for research and innovation, and concludes as the third collaborator of this project. In October this year, we drove to Autoliv in Vårgårda and met up with Chalmers for the first run of our practical tests, got together as collaborators, merging the systems for executing the tests.

The video below presents one of the tests in sync with the collected radar data. The radar is mounted in the top left corner of the windshield, angled to monitor the torso of the test driver (no other than our CEO and founder, Pelle!). In the top right corner of the screen is a waterfall display analysis of collected samples from the radar. The horizontal axis denotes the range in meters, and the vertical axis indicates time – providing a five-second time window for the measured data, where the latest frame will appear at 0. The total elapsed time is displayed at the top of the graph. A brighter color, fading towards yellow and green, denotes the activity around the driver’s torso. In the video, this color fade at approximately 0.75m from the sensor. The research data is currently analyzed with the assistance of our collaborators at Chalmers in this first act of the research project. We are excited to learn more about this application and move the research forward!

